As the dust settles following the MLB trade deadline, we saw a bevy of relievers change places, though one big name rumored on the block remained in San Diego. Seattle replicated a past practice, trading its leader in saves with one year of team control left, fitting its modus operandi of retooling on the fly. Of course, this remained an easier gamble with Andrés Muńoz on a team-friendly contract running through 2025 with team options through 2028.
Particular shifts in the high-leverage landscape will be explored throughout this week’s post, with eyes on the final third of the season. Pennant chases and leverage pathways cleared via trades may determine fantasy upside the rest of the season. With this in mind, understand bullpen hierarchies rarely remain static — not only do the relievers listed in our high-leverage pathways change, team concept pathways towards them also must adapt. My updated rating system uses one of these four descriptors, along with identifying the relievers in the mix for save chances:
- Mostly Linear: A more traditional approach, with a manager preferring one reliever in the seventh inning, another in the eighth and a closer (when rested) in the ninth. There’s shades of gray. For instance, if the Yankees face a team with their best pocket of right-handed hitters lining up for the eighth inning, Clay Holmes may be called upon, since it represents the highest-leveraged moment in the contest.
- Primary Save Share: Team prefers one reliever as the primary option for saves, but he will also be used in match-ups based situations, whether dictated by handedness or batting order pocket in the late innings, which provides more than one reliever save chances each series or week throughout the season.
- Shared Saves: Usually two relievers split save opportunities, sometimes based on handedness or rest or recent usage patterns keeping them fresh. While these situations usually rely on a primary and ancillary option, others can get into the mix. One reliever may eventually emerge, so this can be fluid.
- Match-ups Based: This approach features multiple relievers, usually between two-to-four, facing pre-set lineup pockets, based on their strengths and weaknesses in each series. A primary save share may emerge, but he’s not working exclusively in the ninth inning, unless usage patterns change during the year. Based on performance or necessitated by injury issues.
Those in leagues which use SOLDS (saves plus holds) or holds as a separate category should target relievers in the stopper/HLR (highest leveraged reliever) or stealth labels on teams with winning records on stream favorable match-ups on a weekly basis.
American League High-Leverage Pathways

Before delving into the new leverage patterns for two teams courtesy of trades, one must acknowledge Jordan Romano landing on the 15-day injured list with a back injury sustained during the All-Star game. Keeping their eyes on the remainder of the season, Toronto opted for resting him and ramping him up for the last six weeks. What’s not known is whether they will keep Erik Swanson in his current HLR role or use him as their preferred save option in the interim. They added Jordan Hicks, making the leverage ladder deeper, but roles may remain fluid until Romano returns.
Not only did the White Sox gut its leverage ladder, the team announced that closer Liam Hendriks underwent Tommy John surgery and will miss the entire 2024 season:
Chicago #WhiteSox closer Liam Hendriks underwent successful surgery this morning to repair a torn ulnar collateral ligament in his right elbow in a procedure performed by Dr. Keith Meister at TMI Sports Medicine and Orthopedic Surgery in Arlington, Texas.
— Chicago White Sox (@whitesox) August 2, 2023
After appearing as a saves stash option in multiple posts, Gregory Santos takes over as the projected primary save share moving forward. Kansas City also paved the way for a new preferred save option, trading Scott Barlow to San Diego, and putting Carlos Hernández firmly on fantasy radars, though he’s also been highlighted in previous columns.
Otherwise, many situations remain stable following the deadline, which makes this one of the toughest years for adding saves from the waiver wire. With this in mind, here’s the updated saves and SOLDS trends chart for the American League, including games played through August 1:
National League High-Leverage Pathways

Courtesy of a trade with Seattle, Arizona may finally have its primary save share solved, adding veteran Paul Sewald in a four-player deal. Through 45 appearances this year before the deal, he converted 21 of 24 save chances with a 60:14 K:BB (27.2 K-BB%) and a 1.02 WHIP over 43 innings. His ratio indicator range of a 1.74 expected ERA (xERA) and 2.74 SIERA make him a trusted ninth-inning option without much pending regression from a 2.94 ERA — in fact, he could benefit from positive migration towards the mean.
He’s produced a 14.5 swinging strike rate with a 32.1 O-Swing (outside the strike zone) percentage and allowed a 70.3 contact rate this season. Of his 95 batted ball events against this year, he’s only given up four barrels (4.2 barrel percentage) with strong expected results:
- .159 expected batting average (xBA) — 99th percentile
- .255 expected slugging (xSLG) — 99th percentile
- .217 expected weighted on-base average (xwOBA) — 99th percentile
His presence also provides stability for a leverage ladder which rates as one of the most fluid all season long. Washington did not move any of its high-leverage relievers, keeping Kyle Finnegan atop his bullpen hierarchy. It will take a week or two, but St. Louis should deploy Giovanny Gallegos as the primary save share with HLR tendencies, like the role David Robertson filled for the Mets. Speaking of New York, they have been using Brooks Raley in save situations, but keep tabs on how usage patterns progress over the rest of the season.
Here’s the updated saves and SOLDS trends chart for the National League, including games played through August 1:
Game-Finished Percentages and Save Shares
Recent trades will make this process a bit more difficult, but I will do my best to make sense of them going forward. Since there’s a multitude of relievers back from early season injuries, their results may alter based on time missed, which will provide a clearer snapshot of who receives the most chances at the end of contests for their respective teams. For now, here’s our updated chart displaying relievers who possess a games-finished percentage of 70 percent or better, with a save share of at least 60 percent and a K-BB percentage above 20 percent:
Because some teams deploy match-ups-based save situations, this chart reduces the games-finished percentage and save share percent by 10 points, with the same criteria for the other two categories in this exercise:
Last, the leaderboard of games-finished through August 1:
Relievers on the Rise
1. Félix Bautista (BAL) — He’s been scoreless his past 13 appearances, spanning 16 innings with a 30:4 K:BB, converting all nine save chances. He’s recorded more strikeouts than walks in 30 straight contests (since May 12), producing an eye-popping 71:8 K:BB (50.4 K-BB percentage) and 56.8 strikeout rate through 34.2 innings. He’s also registered at least one strikeout in 38 straight games. Through his first 47 games, here’s how “The Mountain” stacks up with Edwin Díaz from last season — focus on the last column, multiple-inning outings:
2. Gregory Santos (CWS) — As intimated above, trades and an injury provide him runway as the primary save share for the White Sox through the end of the season. He posted an 11:2 K:BB through 10.1 innings in July with two saves. Fueled by his slider, he converted two saves in July. If his swinging strike rate with it continues, hopefully he reduces his WHIP and no longer appears in messy innings, inheriting runners:

3. Carlos Hernández (KC) — Over his past 13 games, he owns a 17:5 K:BB with a win, a save and seven holds through 14.1 innings. Better news, here’s his swinging strike rates by pitch in this time frame:
- Four-seam: 15.8 percent swinging strike rate
- Slider: 17.7 percent swinging strike rate
- Curve: 24 percent swinging strike rate
- Split-finger: 22.7 percent swinging strike rate
4. Andrés Muñoz (SEA) — After missing time this season, last year’s breakout reliever has not turned in similar results, with his strikeout percentage down, walk rate up and O-Swing (outside the strike zone) sitting almost eight percentage points below last year’s results. Hope lies in his arsenal, featuring a plus-slider and his manager’s trust in him for high-leverage events. Only downside, he may be used in a game’s biggest situation, as he did in the playoffs last year, which would cap his save total for the final two months. Still, with Sewald removed from the equation, it should make Muñoz the preferred option for saves in Seattle.
“Closer” Concerns
1. Alex Lange (DET) — It’s been explored here before, but the lingering command issues in outings by Detroit’s “closer” makes him a ratio risk for fantasy players. On Wednesday, he recorded two quick outs, both via strikeout, then issued a two-out walk, followed by a single and two more walks, forcing in a run before his removal from the contest in a non-save outing. Through 44 appearances, spanning 43.3 innings, he owns a 1.32 WHIP with a 13.1 K-BB percentage. Sure, his whiff rates seem alluring, but he can be streaky and if his strike percentage continues to decrease, it may result in fewer save chances through the end of the season.
Saves Stash List
1. Erik Swanson (TOR) — Although he’s not his team’s closer, he leads the Blue Jays in Win Probability Added and may be the preferred save option with Romano on the injured-list. Since he also represents his leverage ladder’s HLR, he may face the heart of the order, but this job went to Jordan Hicks during a win over Baltimore on Wednesday.
2. Drew Smith (NYM) — There’s zero reason for the team to rush Edwin Díaz back for this season, and although the team did not trade Brooks Raley or Adam Ottavino, neither feels like a stable option for save situations. It may take a couple of weeks, but if Smith can generate more whiffs while reducing his walk rate, simply by migrating his results towards the mean, he could forge his way into a share of saves for the final six weeks of the season. Not for the faint of heart, but at this point after the trade deadline, it’s slim pickings.
3. Matt Brash (SEA) — He’s already collected three wins over his past six appearances and all of his indicators present an arsenal capable of closing out games. Even if it’s an ancillary save or two for the rest of the season, his vulture wins and team’s advantageous schedule make him a sneaky play in deeper formats.
4. Jason Foley (DET) — It feels like fantasy players have been down this road too many times this season, but if Lange’s command issues persist, though he’s been resilient with A.J. Hinch’s backing, Foley could emerge with a larger save share going forward. Let this situation marinate, but be ready if a change occurs.
Ancillary Save Relievers of Interest
Ratio Erasers
In an effort to make these relievers reflective of a process, any reliever listed has recorded a Strike percentage of 65 percent or better, a swinging strike rate of above 15 percent, a contact rate allowed percent below 70 and a K-BB percentage of 20 percent or higher in July, while not being his team’s primary save share, with the caveat of having more shutdowns than meltdowns:
- Joel Payamps (MIL) — 67.3 Strike%, 16.7 SwStr%, 64.8 Contact%, 40 K-BB%
- Robert Stephenson (TBR) — 72.7 Strike%, 33.9 SwStr%, 43.8 Contact%, 33.3 K-BB%
- Dominic Leone (LAA) — 67.6 Strike%, 21.9 SwStr%, 58.9 Contact%, 29 K-BB%
- Dauri Moreta (PIT) — 68 Strike%, 15.1 SwStr%, 67.5 Contact%, 37.2 K-BB%
- Joe Jiménez (ATL) — 67.5 Strike%, 17.5 SwStr%, 68.1 Contact%, 30.2 K-BB%
- Shintaro Fujinami (BAL) — 68.8 Strike%, 16.1 SwStr%, 69.3 Contact%, 28.8 K-BB%
During July, only seven qualified relievers recorded a K-BB percentage of 25 percent or higher, a strike percentage greater than 65 percent, a swinging strike rate of 15 or better and produced a contact rate allowed of 65 percent or lower:
- Félix Bautista (BAL) — 43.8 K-BB%, 68.4 Strike%, 22.6 SwStr%, 59.4 Contact%
- Joel Payamps (MIL) — 40 K-BB%, 67.3 Strike%, 16.7 SwStr%, 64.8 Contact%
- Aroldis Chapman (TEX) — 38.7 K-BB%, 66.9 Strike%, 22 SwStr%, 55.9 Contact%
- Devin Williams (MIL) — 37.8 K-BB%, 65.7 Strike%, 23.6 SwStr%, 53.8 Contact%
- Robert Stephenson (TBR) — 33.3 K-BB%, 72.7 Strike%, 19.2 SwStr%, 43,8 Contact%
- Paul Sewald (ARI) — 32.6 K-BB%, 71.2 Strike%, 19.2 SwStr%, 63.4 Contact%
- Dominic Leone (LAA) — 29 K-BB%, 67.6 Strike%, 21.9 SwStr%, 58.9 Contact%
For an expanded look at my high-leverage ladders, please use the link provided below. Please note, it’s a Google Doc:
Last, but not least, our updated tiered rankings for relievers with separate tabs for Saves and SOLDS formats on Google Sheets:
Statistical Credits: Fangraphs.com; Baseball-Reference.com; BaseballSavant.com; BrooksBaseball.net
For daily coverage of bullpens, check out my work at Reliever Recon.
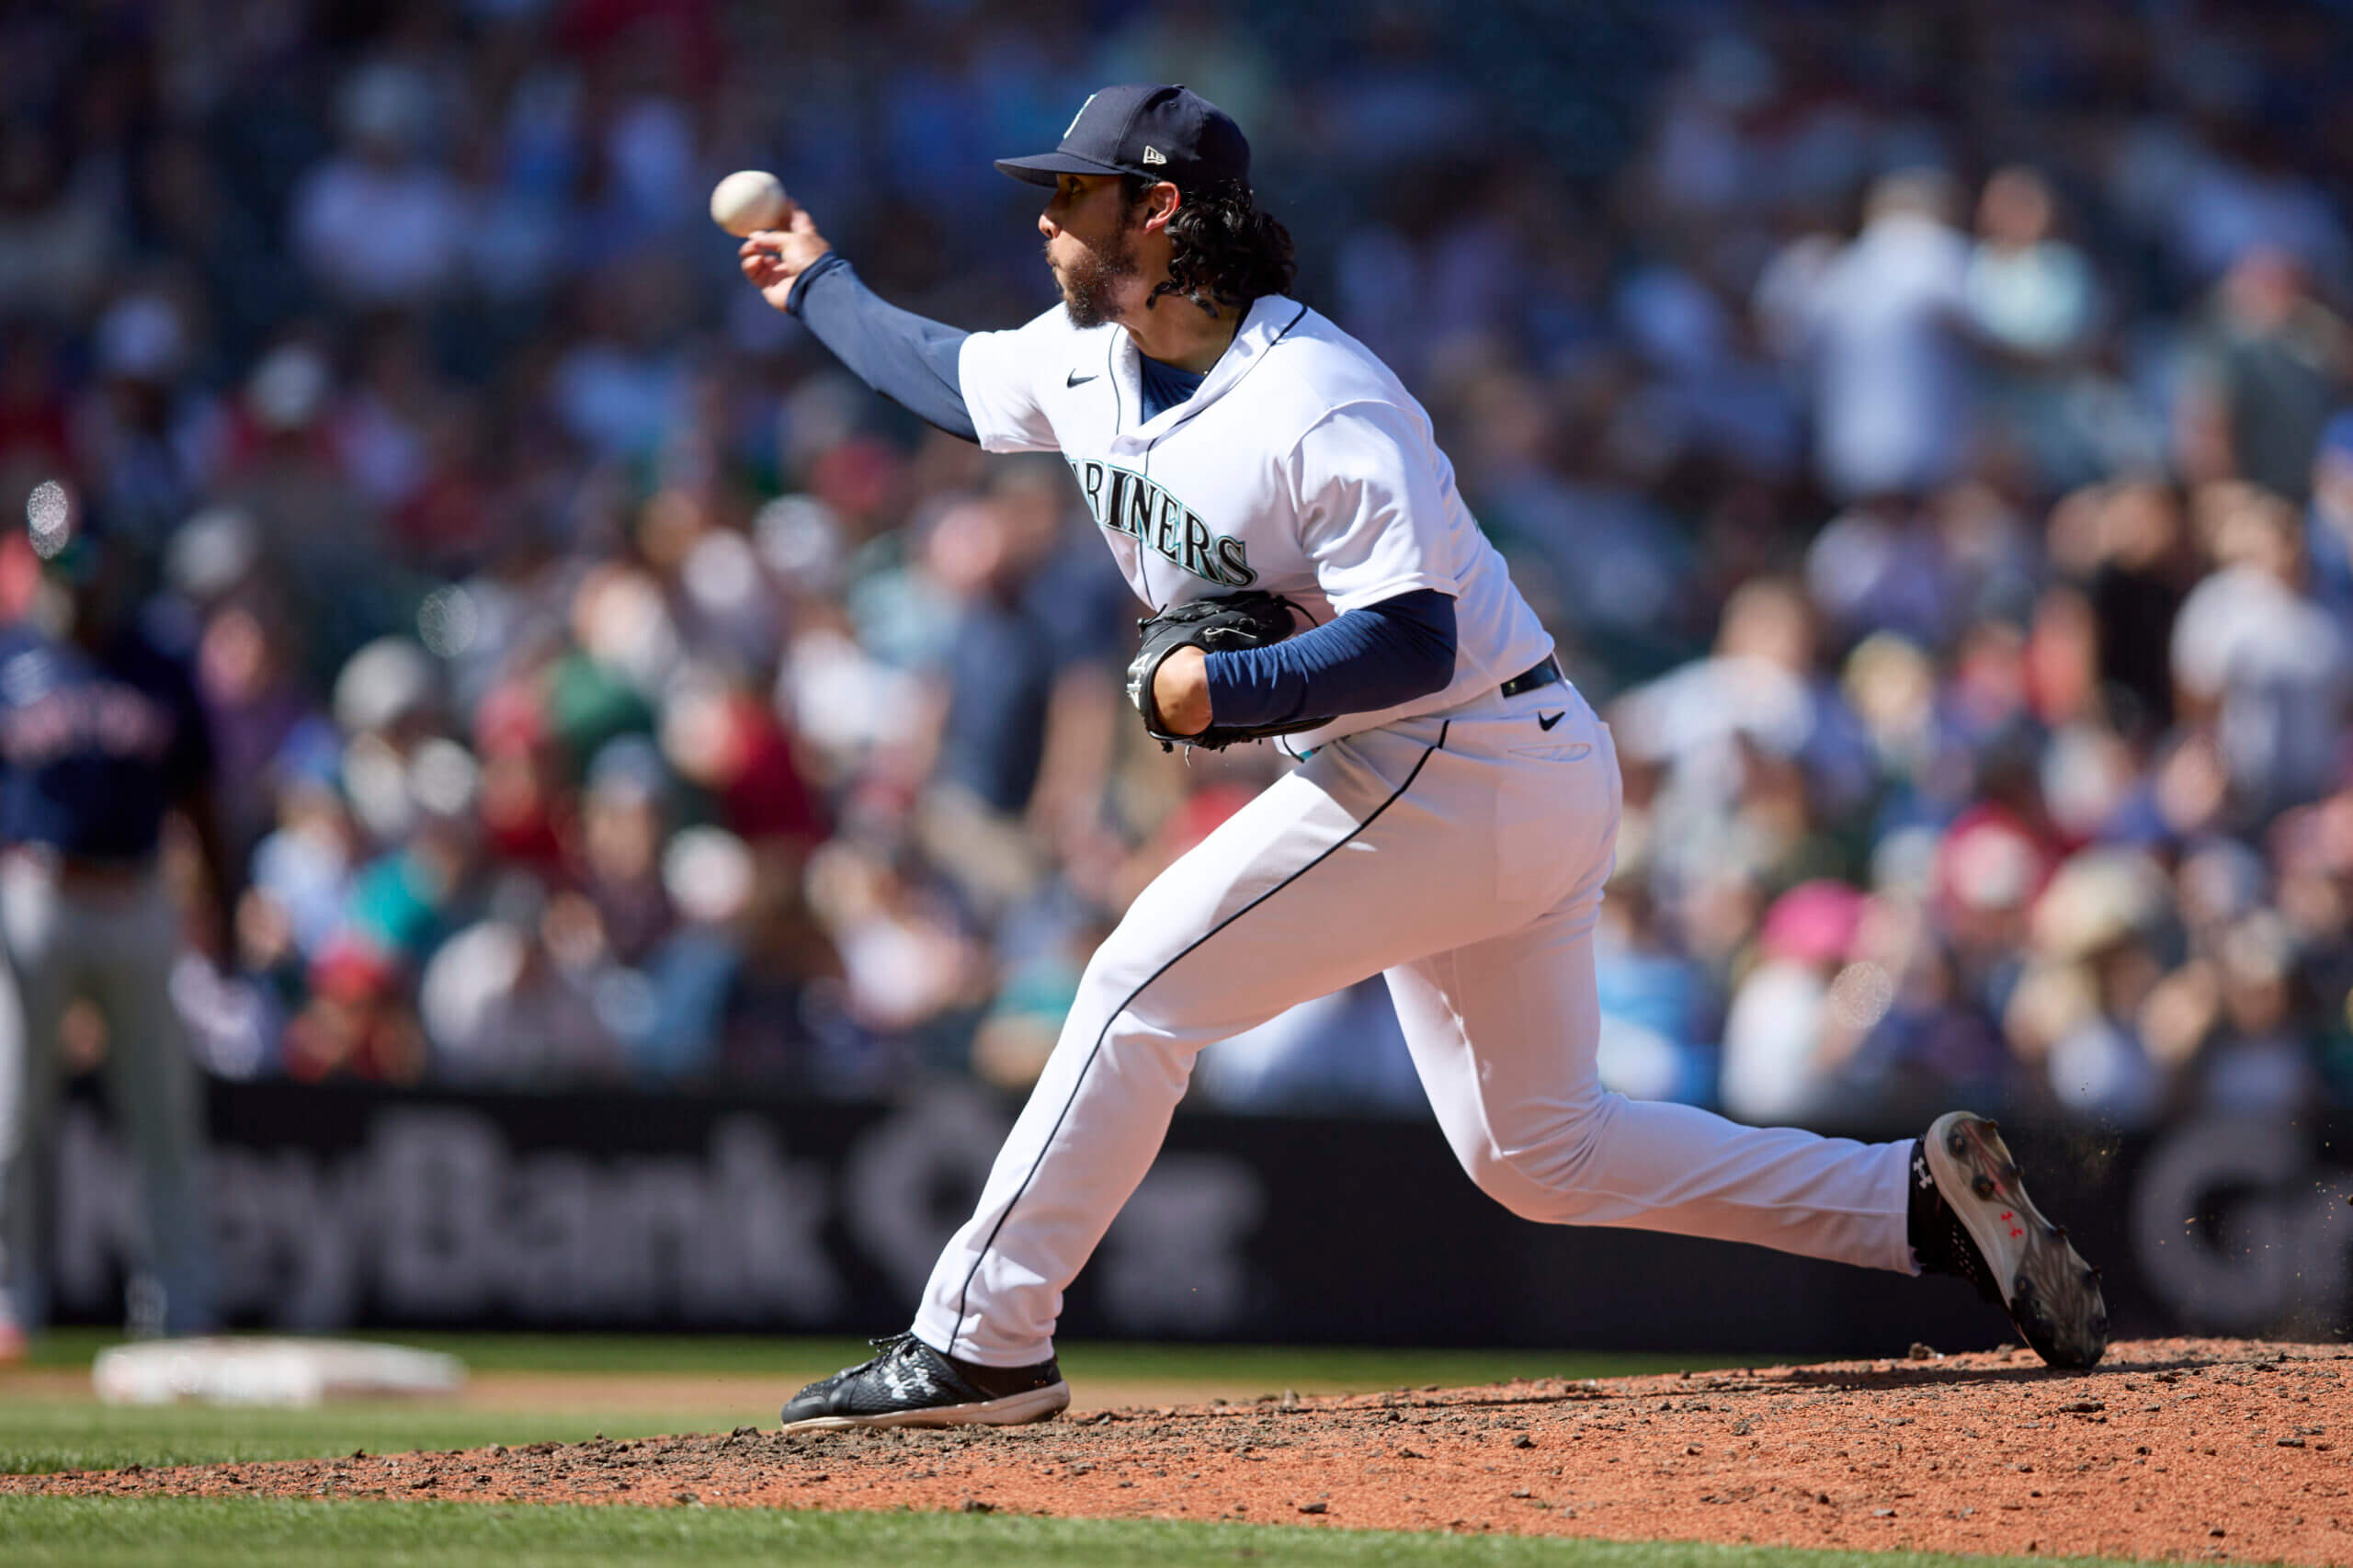
(John Froschauer-USA TODAY Sports)
#Bullpen #report #Trade #fallout #relievers #rise #top #stash #candidates