
XRP finds itself at a pivotal crossroads amid mixed signals, as its next direction from here could lead to the reclamation of the $1 target or a crash to the $0.35 region.
EGRAG, a prominent crypto chartist, has been closely monitoring XRP’s price action and recently shared a follow-up analysis highlighting the asset’s uncertainty and price prospects.
He emphasized the importance of the Descending Trend Line ‘A’ (DTL ‘A’) as a critical indicator shaping XRP’s trajectory. Previously, on Sept. 4, EGRAG noted that this trendline was a formidable resistance level for XRP.
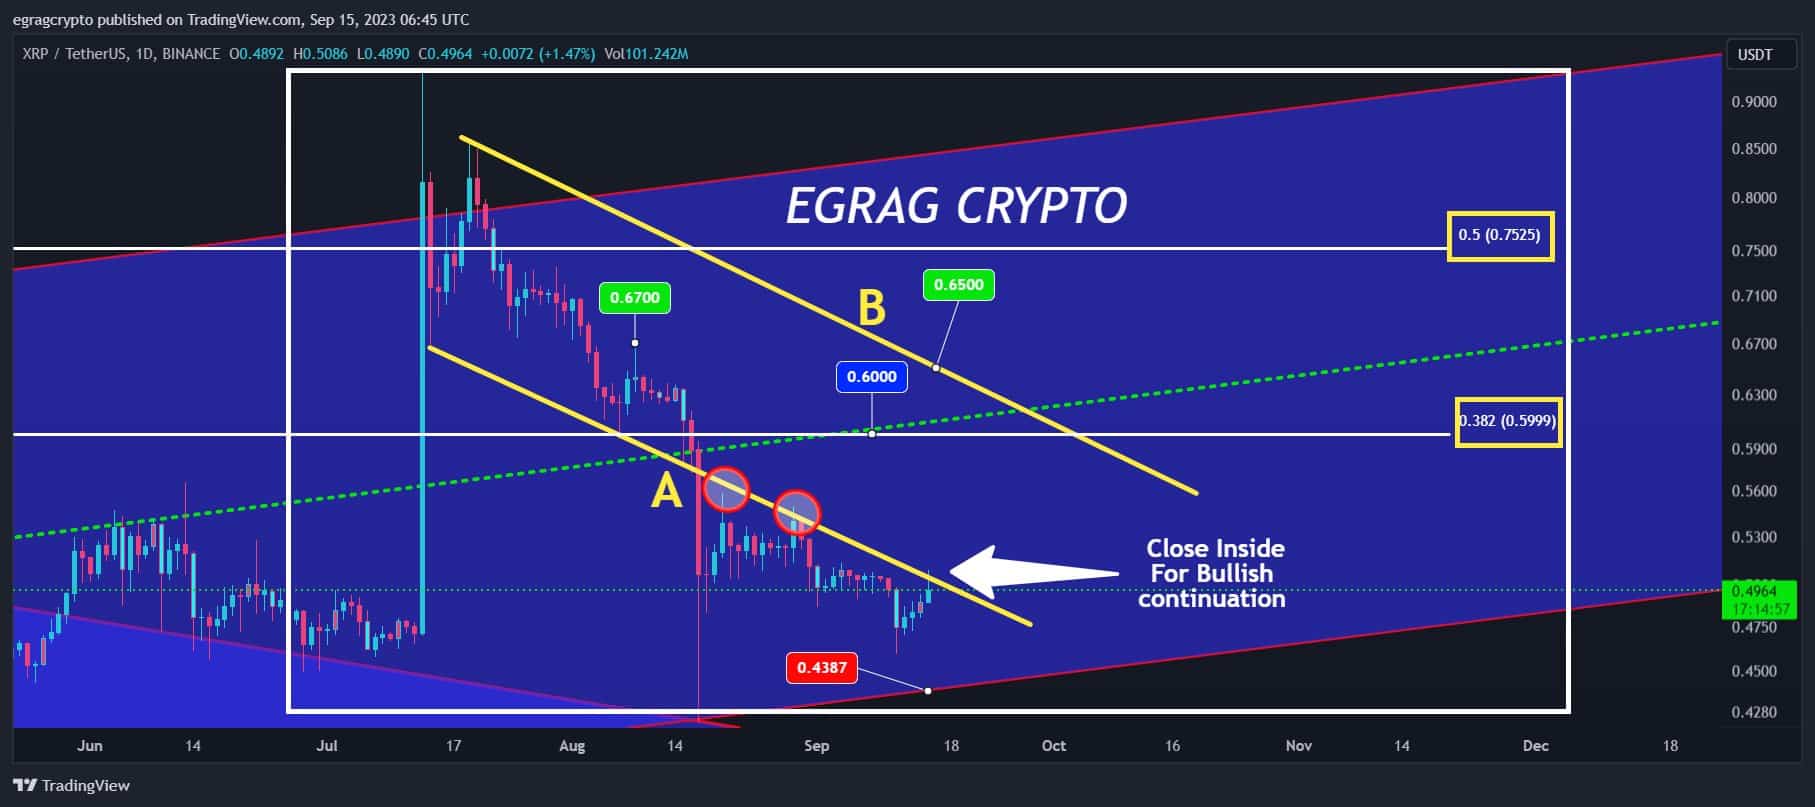
The DTL ‘A’ serves as a dynamic resistance barrier, upholding the continuation of the market’s downtrend. EGRAG pointed out that failure to breach and hold above this trendline could sustain the bearish trend.
– Advertisement –
History has shown that XRP’s past two attempts to break above it in the past were met with corrections to lower levels. The asset recently made a third attempt but also registered failure, fueling concerns.
If XRP does not close above the DTL ‘A’ on the daily timeframe, EGRAG believes the continuation of the bearish trend could see the asset drop to lower levels. He stressed the possibility of XRP plummeting to the $0.43 – $0.35 range.
However, should XRP close above the trendline, EGRAG posits a bullish scenario where the asset could reclaim its upward momentum.
This upward momentum could see XRP surpass DTL ‘A’ and breakthrough DTL ‘B’ at levels above $0.65 – $0.67. Such a breakout could pave the way for XRP to reach $1 or beyond. However, the asset’s next direction at the current pivotal point remains to be seen.
XRP Sees Mixed Signals
Meanwhile, XRP’s chart patterns contribute to the uncertainty in the market, as they remain indecisive, reflecting the ongoing battle between bears and bulls.
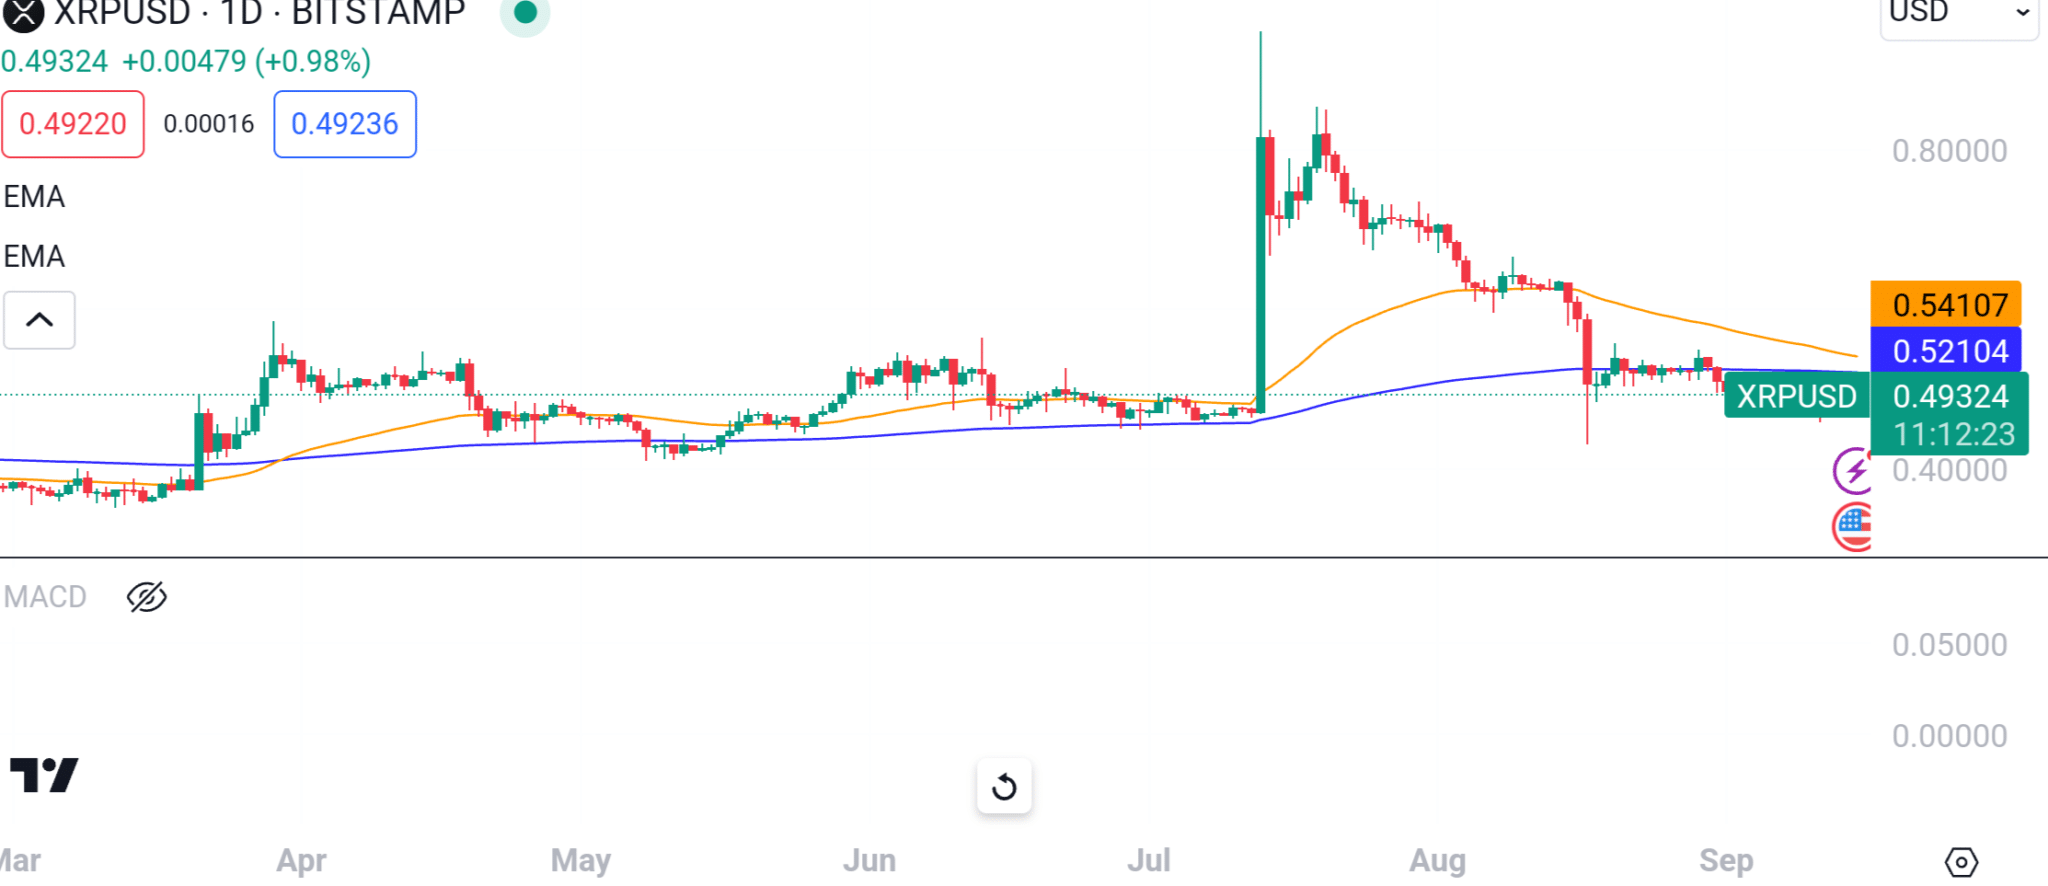
Notably, XRP is trading at $0.4932, indicating a modest 0.98% increase over the past 24 hours. However, this positive movement doesn’t necessarily signify a complete shift in sentiment.
One concerning factor is that XRP continues to trade below the 50-day EMA at $0.5410 and the 200-day EMA at $0.5210 on the 24-hour timeframe. This suggests that bearish sentiments persist in both the short and long term.
Intriguingly, amidst the bearish signals conveyed by the EMAs, XRP’s Moving Average Convergence Divergence (MACD) indicator on the daily timeframe delivers some hope to investors.
The MACD Line recently crossed above the Signal Line, a development that typically indicates the potential exhaustion of a downtrend and hints at a possible price surge.
It’s worth noting that the last time such a crossover occurred was on July 12, just before XRP experienced a meteoric rise to its yearly high of $0.9380. Conversely, the Signal Line crossed above the MACD Line shortly after, preceding XRP’s subsequent decline from that peak.
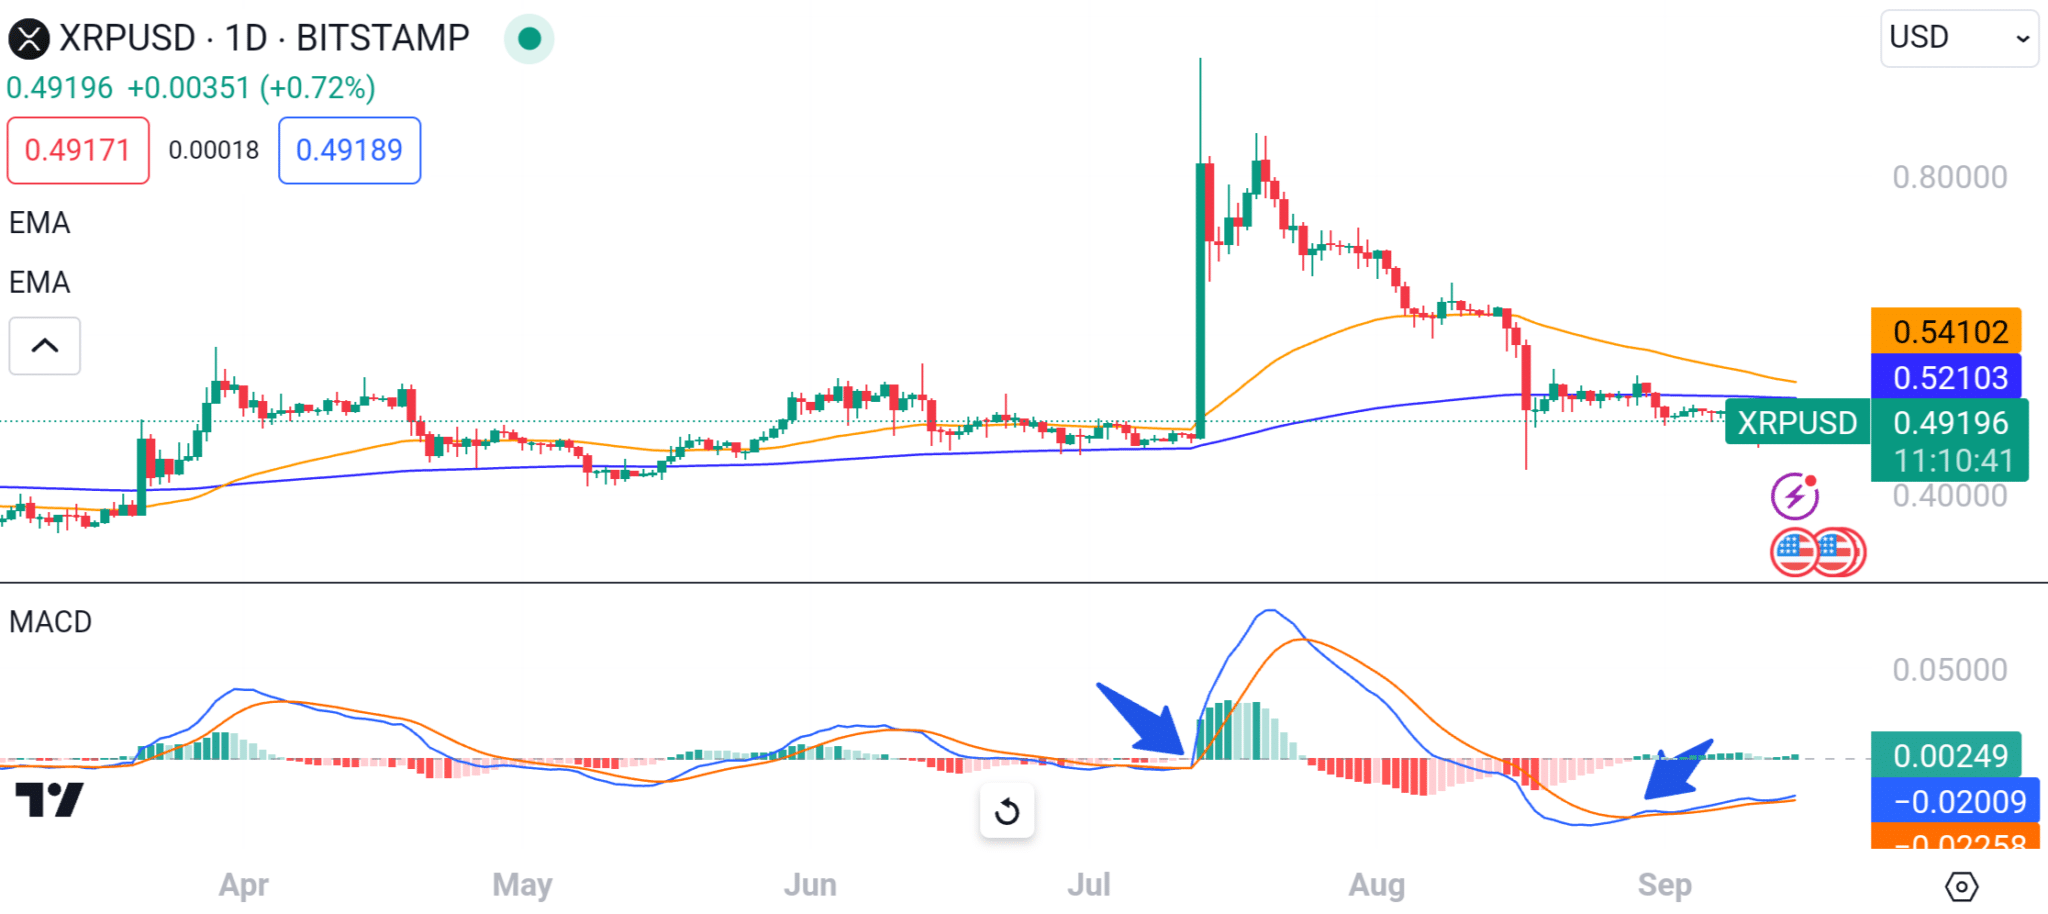
With the MACD Line crossing above the Signal Line again, market observers are optimistic about the potential for an upswing in XRP’s price. However, the proximity of the two lines suggests that the outcome of this crossover is far from certain.
Follow Us on Twitter and Facebook.
Disclaimer: This content is informational and should not be considered financial advice. The views expressed in this article may include the author’s personal opinions and do not reflect The Crypto Basic’s opinion. Readers are encouraged to do thorough research before making any investment decisions. The Crypto Basic is not responsible for any financial losses.
-Advertisement-
#XRP #Decisive #Point #Move #Lead #Crash