XRP may see significant price movements in 2024 after a 7-year accumulation and Symmetrical triangle formation, predicts analyst U-copy.
According to a recent technical analysis by U-copy on X, XRP is approaching a critical juncture that could signal significant price movements in the upcoming months. The analysis highlights crucial trends, patterns, and technical indicators, pointing to a potential breakout that has been seven years in the making.
Accumulation Phases and Triangle Formation
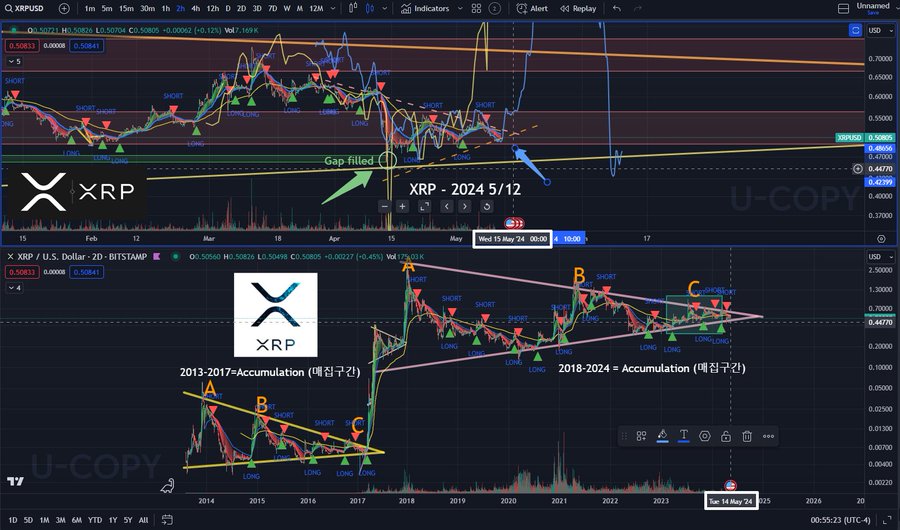
The chart analysis identifies two significant periods of accumulation for XRP: the first from 2013 to 2017 and the second ongoing from 2018 to 2024. The earlier phase (Zone A) saw price consolidation, eventually leading to a notable price increase. The current phase (Zones B and C) represents a seven-year accumulation period that suggests the price has been stabilizing within a certain range. This pattern of long-term accumulation typically precedes a significant breakout.
A prominent feature of the current chart is the triangle formation visible from early 2020, converging around May 2024. This formation, characterized by lower highs and higher lows, indicates decreasing volatility and consolidation, often a precursor to major price movements.
Another notable point is the “gap fill” at $0.46, indicating a return to the original pre-gap level, which can signal potential support or a reversal point.
The period from May 15 to August 2024 is highlighted as a critical time frame, with the end of the triangle formation expected to play a pivotal role in determining XRP’s future price action. The analysis anticipates a substantial bull cycle in 2024, driven by the culmination of the long-term accumulation phase and the triangle pattern’s breakout potential.
Previous Predictions
Historical patterns also support this outlook. In February, Crypto Basic reported a symmetrical triangle formation on XRP’s three-week chart, which previously led to a nearly 66,000% surge in the 2018 bull run when XRP rallied 65,931% from $0.0053 to $3 in January 2018. The current symmetrical triangle pattern suggests a similar potential for XRP price movements.
– Advertisement –
World of Charts forecasted a potential XRP surge of 360.63% to reach $2.37 upon breaking out from its multi-year symmetrical triangle, while Captain Faibik anticipates a 253.36% increase to $1.6458.
Recent data shows XRP trading at $0.4972 with a market cap of $27.39 billion despite a recent price decline.
Disclaimer: This content is informational and should not be considered financial advice. The views expressed in this article may include the author’s personal opinions and do not reflect The Crypto Basic’s opinion. Readers are encouraged to do thorough research before making any investment decisions. The Crypto Basic is not responsible for any financial losses.
-Advertisement-
#Expert #Timeline #XRP #Break #7Year #Symmetrical #Triangle